How do you graph #F(x)=3x^2+4x-1 #?
2 Answers

Find the vertex and plot some "nice" points around that point.
Explanation:
The vertex is at
The corresponding y value is at
Find some "nice" values of x that are around the vertex.
Plot the points

show the perfect answer below
Explanation:
show the steps
For example
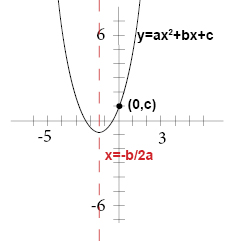
A nonlinear function that can be written on the standard form
is called a quadratic function.
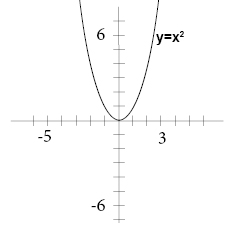
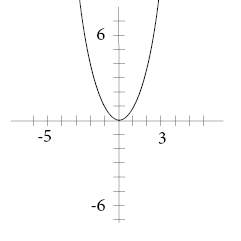
All quadratic functions has a U-shaped graph called a parabola. The parent quadratic function is
The lowest or the highest point on a parabola is called the vertex. The vertex has the x-coordinate
The y-coordinate of the vertex is the maximum or minimum value of the function.
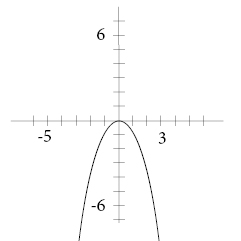
A rule of thumb reminds us that when we have a positive symbol before x2 we get a happy expression on the graph and a negative symbol renders a sad expression.
The vertical line that passes through the vertex and divides the parabola in two is called the axis of symmetry. The axis of symmetry has the equation
The y-intercept of the equation is c.
When you want to graph a quadratic function you begin by making a table of values for some values of your function and then plot those values in a coordinate plane and draw a smooth curve through the points.
now we will graph
donot forget Make a table of value for some values of x. Use both positive and negative values!
That will help you in sketch.
