How do i graph limits?

1 Answer
Oct 21, 2014

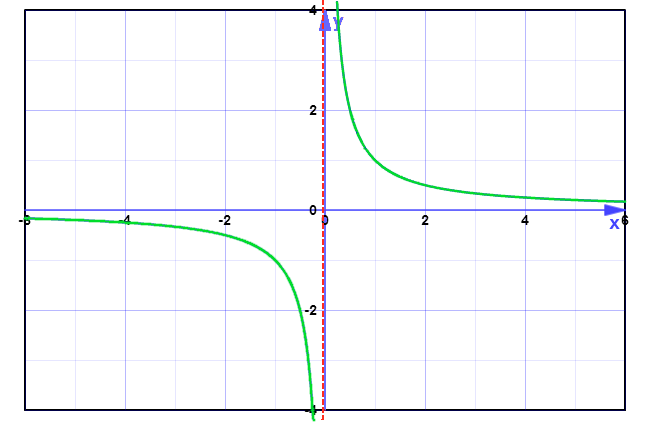
If your function approaches infinity or negative infinity as x approaches your limit you can represent the limit with a line or dashed line:

f(x)=1/xf(x)=1x

limx->0+ = oo
limx->0- = -oo

![http://www.mathsisfun.com/data/http://function-grapher.php](https://useruploads.socratic.org/UdYlF3dREOHc8A1tF00w_save.png)

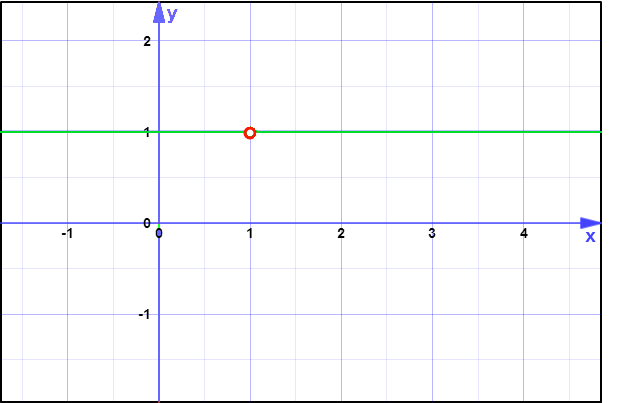
If your function does not trail off into infinity or negative infinite as x approaches your function you can represent the limit with an empty circle:

f(x) = (x - 1)/(x-1)

limx->1=undefined

![http://www.mathsisfun.com/data/http://function-grapher.php](https://useruploads.socratic.org/PYobADucTDaV28Iwbsj8_point.png)