How do you sketch the graph of #y=-(x+2)^2-2# and describe the transformation?
1 Answer

The graph of
graph{-(x+2)^2-2 [-10, 10, -5, 5]}
Its transformation is a reflection over the x-axis, a translation of 2 units left and a translation of 2 units down.
Explanation:
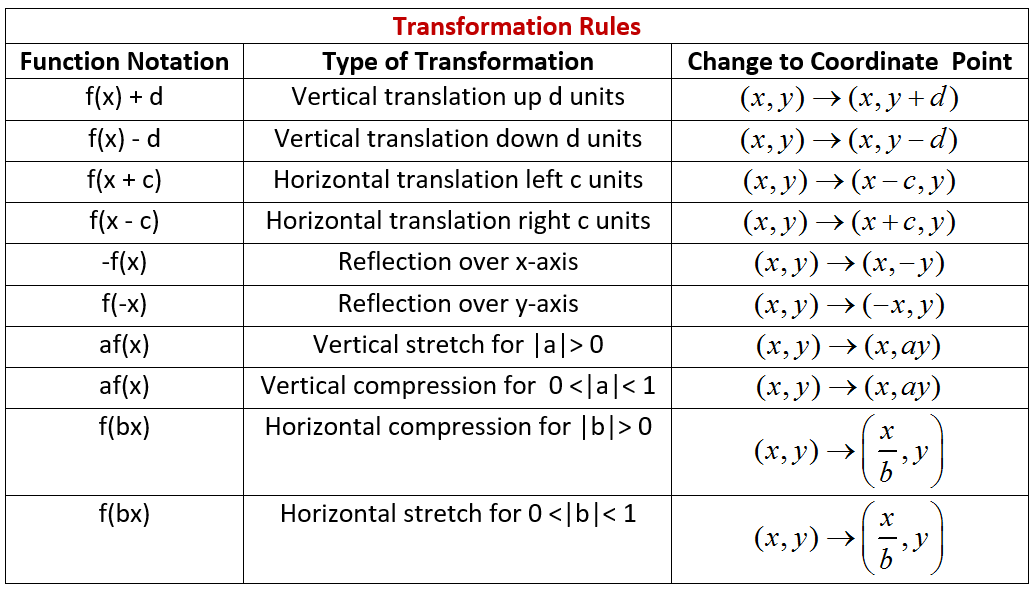
Have a look at the following summary for transformation rules of graphs:
Transformations are called transformations because they start off with the "original" or "standard" function
The original function in this case is
graph{x^2 [-10, 10, -5, 5]}
We notice that it has 3 transformations happening to it:
- There is a
#color(blue)2# being added directly to the#x# , so it is#f(x+color(blue)2)# , making it#y=(x+color(blue)2)^2# --> this means that there will be a horizontal translation left of 2 units. In the graph, we take the original function and shift it left 2 units:
graph{(x+2)^2 [-10, 10, -5, 5]} - There is a negative sign
#color(red)-# outside of the#f(x+2)# , making it#y=color(red)-(x+color(blue)2)^2# --> this means that there will be a reflection over the x-axis. In the graph, we take this shifted function and "flip" it over the x-axis:
graph{-(x+2)^2 [-10, 10, -5, 5]} - Finally, there is a
#color(green)2# being subtracted to the whole function, so#color(red)-f(x+color(blue)2)-color(green)2# . In the graph, this means that the shifted function needs to be shifted two units down:
graph{-(x+2)^2-2 [-10, 10, -5, 5]}
