How do you graph #y=sqrtx-2# and what is the domain and range?
1 Answer
Feb 21, 2018
See below.
Explanation:
The graph looks like this:
graph{sqrt(x)-2 [-10, 10, -5, 5]}
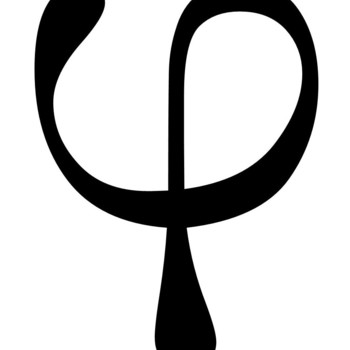
The domain is all possible values of
Here,
So
In interval notation, the domain is
The range is all possible outputs of
Since a square root function does not give an answer above

